What’s New In DevTools?
In September last year, I wrote about some of the latest updates in our beloved DevTools, across Firefox, Chrome, Safari, and Edge. Four months have already passed since then, and the different teams working on DevTools have been busy! In these four months, they built a lot of new things for us to use. From powerful productivity improvements to entire new panels, they’ve been continuing to close the parity gap and innovate with new means of debugging and improving our web experiences.
That means it’s high time for another DevTools update, so let’s jump right in!
- Chrome
- Edge
- Safari
- Firefox
The Chrome team just released a new panel that makes it very straightforward to record and replay user flows: the Recorder panel.
Record, Replay And Measure User Flows
If you’ve ever found yourself having to repeat the same navigation steps over and over again in a web app in order to investigate a bug, then this might change your life!
While you’re in the More tools menu, take a look around. Chrome DevTools has more than 30 individual panels! That’s a lot, but keep in mind they’re all here for a specific reason. There might be aspects of your web app that certain panels could help you with. Be curious, and if you have no idea what a thing does, remember there are docs you can read.
While Microsoft’s browser team continues to be an active contributor to the Chromium project, they’re also spending more time on new and unique features that only Edge has. Let’s review two of them here.
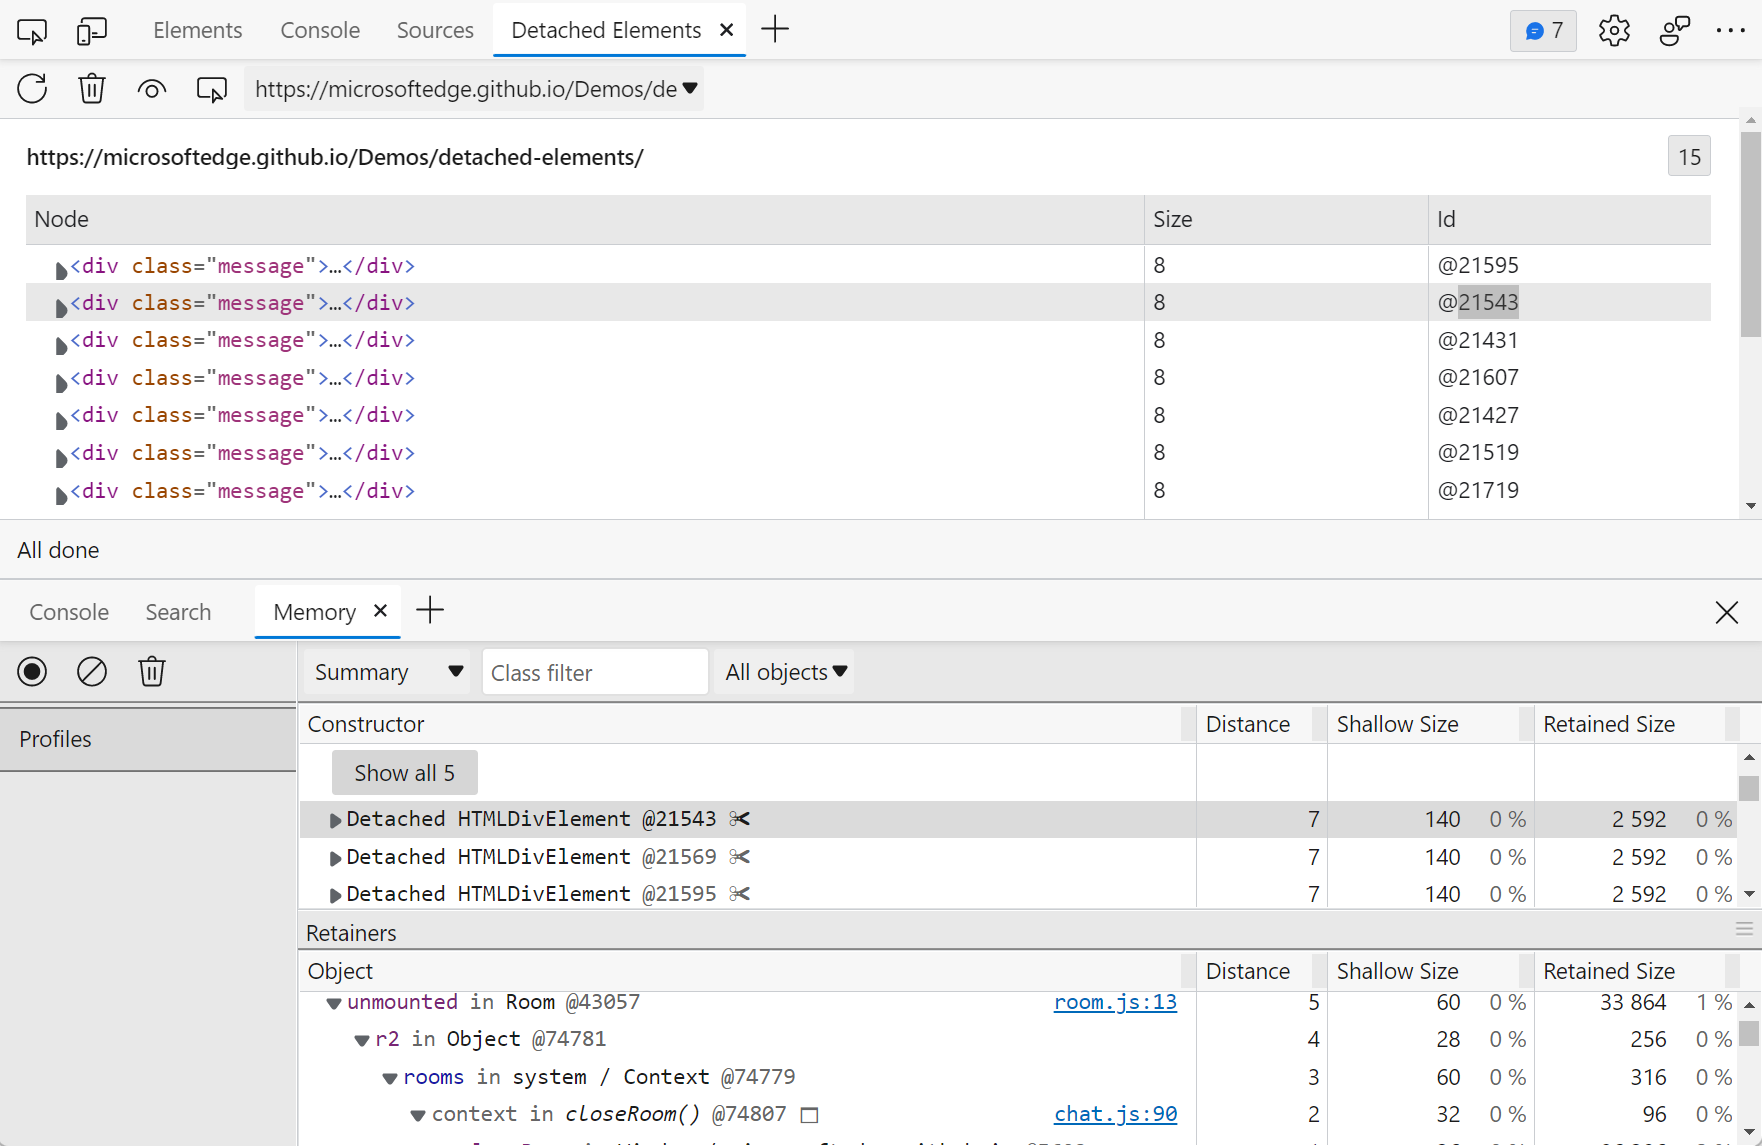
Debug DOM Memory Leaks With The Detached Elements Panel
Edge just launched a memory leak investigation tool, the Detached Elements tools, which can be very useful to investigate leaks in long-running apps.
One of the multiple reasons why web pages leak memory is detached DOM elements: elements that might have been needed at some point, but got removed from the DOM, and never re-attached. When a code base grows in complexity, it’s easier to make mistakes and forget to clean those detached elements up.
If you find that your app keeps on needing more and more memory over time as you use it, give the Detached Elements a try. It can very quickly point you in the right direction.
Learn more about it on the announcement blog post, and the docs.
A Brand New User Interface For DevTools With Focus Mode
Our DevTools have looked the way they do ever since the early Firebug days. Sure, the user interface has evolved over time a little bit, with more tools added, and things re-arranged, but at a high level, it’s still mostly the same.
The Edge team has conducted experiments and user studies that indicate that DevTools can be very overwhelming (did I say DevTools had more than 30 panels already?). While new web developers don’t have a clear idea of where to start and how to explore and use the tools, more experienced developers tend to find themselves in just one or two familiar workflows.
Based on this, the Edge team released a new experimental feature that makes it easier to learn and use DevTools: Focus Mode.
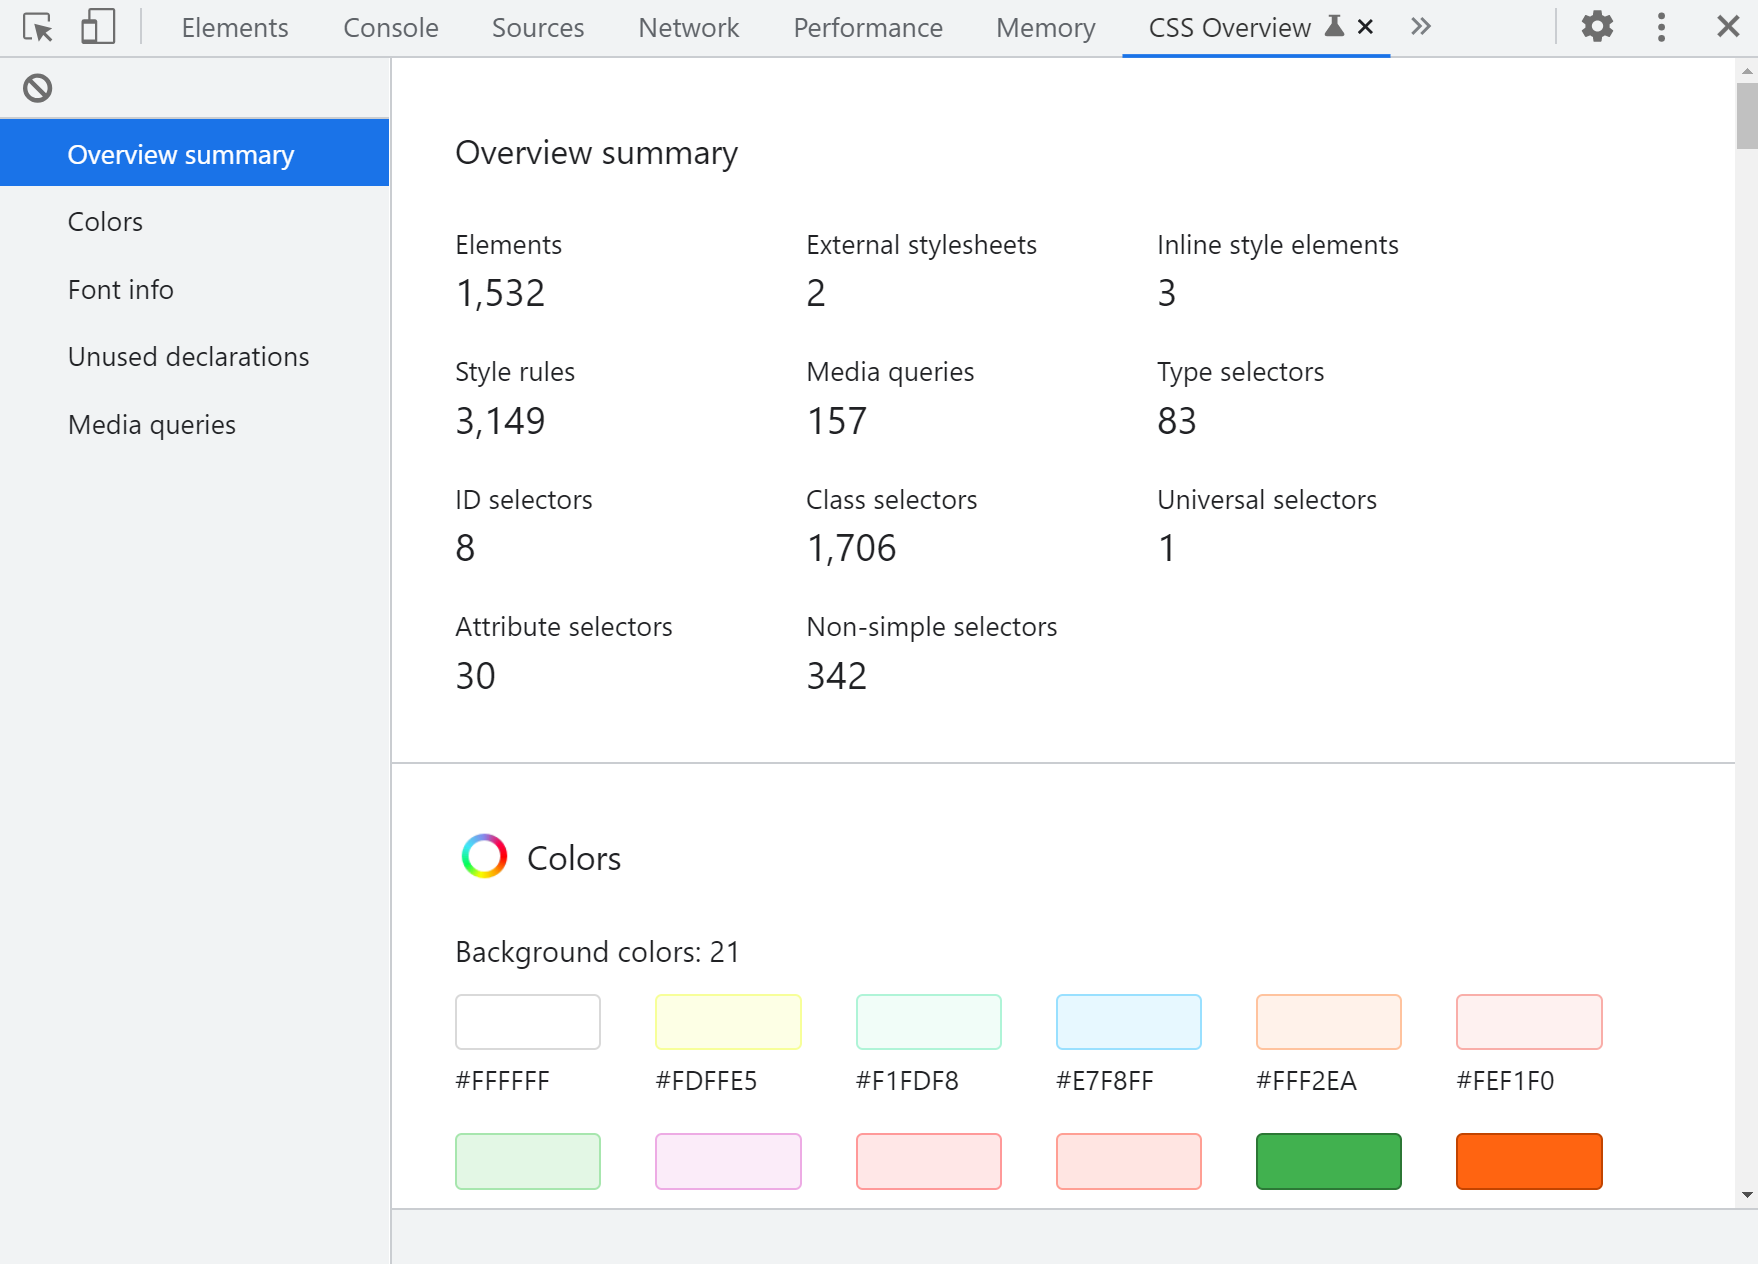
Grouping Of CSS Variables By Types In The Computed Panel
CSS variables (aka Custom Properties) have now been supported on all major browsers for years, and site owners, design systems, and libraries have really started to make extensive use of them. For good reasons, they’re great!
But with this increase in usage, the Styles and Computed panes of our DevTools are starting to feel a little crowded.
Safari released a feature that helps a little bit with this. The Computed pane now lists all CSS variables neatly tucked inside a collapsible section and grouped by value types too. As an example, all color variables are grouped together.

Visually Align And Justify Flex Lines And Grid Tracks
Not long ago, Chrome and Edge got really nice alignment editors for flexbox and grid layouts in their Styles panel. They make working with complex alignment properties such as justify-content or align-items more visual, and therefore a lot easier to understand.
Safari now has a similar visual editor for align-content/items/self and justify-content/items/self CSS properties. It’s very simple to use, just click on the icon next to an alignment value in the Styles panel to open the editor. You can then choose the type of alignment for your flex lines and grid tracks.
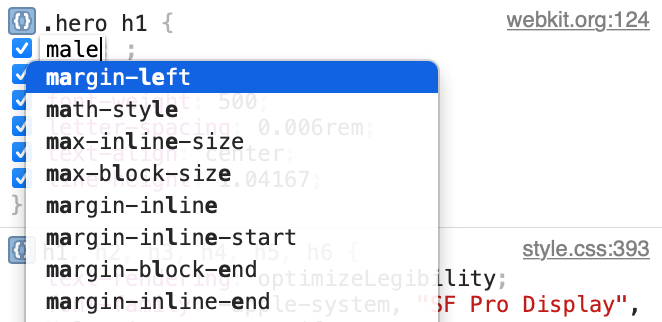
Support For hwb() Function In Inspector
The hwb()) CSS color function is part of the CSS Color Module 4 specification and is a very intuitive method for specifying colors. HWB colors use 3 values: the first one is the hue, which is the starting point for the color. The second and third values are the amount of white and the amount of black that should be mixed in to create the final color.
The hwb function is currently supported on Safari and Firefox, and the Firefox DevTools team just released support for it in the Inspector. Now the hwb function is recognized correctly, and as an added bonus incrementing and decrementing the W and B values with the keyboard automatically keeps them between 0% and 100%.
Ignore Single Lines Of Code In The Debugger
If you spend time debugging JavaScript in DevTools on a large code base that uses frameworks and libraries, you might already be familiar with how to ignore source files. This feature lets you mark entire files as ignored so the debugger does pause within them.
This means you can mark a framework bundle file as ignored for example, and happily debug your own code without fear of stepping into the framework code.
While other browsers also support this feature too, Firefox is innovating with a really cool evolution of it: the ability to ignore ranges of lines within a file! Imagine, you have a utility function in a file that gets called all the time. It might be useful to mark just this function as ignored, and still be able to debug everything else in that file as normal. It may also come useful when using a bundler that groups all of your source code and libraries in the same file.
This feature is, at the time of writing, still experimental. You will need to set the devtools.debugger.features.blackbox-lines boolean to true on the about:config page first.
Once enabled, you can right-click on any line of your source code and choose Ignore line.
I hope you enjoyed these updates, and that they’ll turn out useful when doing web development. As always, if you have feedback, bugs to report, or new feature ideas for DevTools, make yourself heard! It’s impressive to see how far the web platform debugging capabilities have come, and we all can help make it even better!