10 Powerful Plugins for Visualizing Data in WordPress
The ability to easily share data is a foundation of what makes the web so great. But, it’s often been difficult to present data in an easy-to-digest manner. Simply dumping large reams of statistics out in text format may make the information available, but it’s far from user-friendly.
That’s why the job of sharing information is about more than just the information itself. How it is presented can be equally important.
Through WordPress plugins, there are several ways to both calculate and display various kinds of data. Here are some tools to help present information in an attractive visual format.
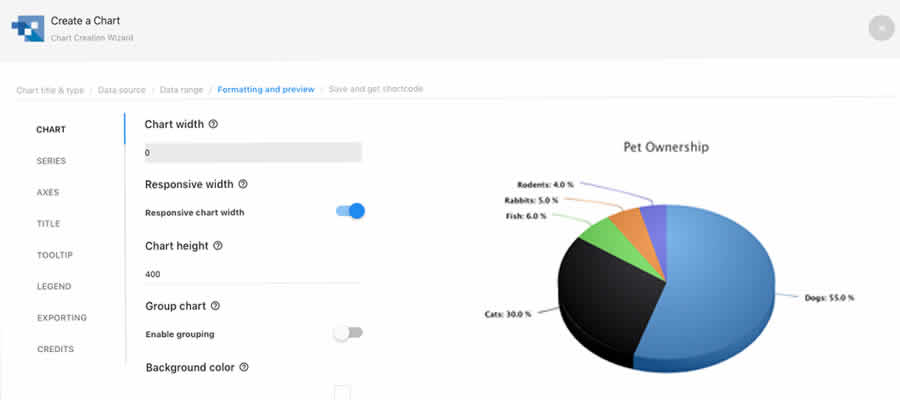
wpDataTables – Tables & Charts
wpDataTables enables you to import custom data and visualize it in the form of a chart. It accepts several data formats, including CSV, Excel, JSON, and XML. From there, choose from 14 types of charts to share with your visitors.
A premium version ups the ante with support for Google Sheets and front-end editing.
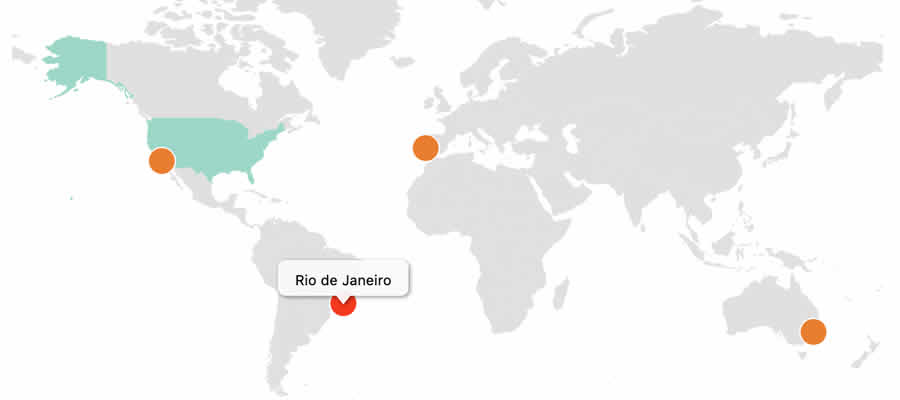
Interactive Geo Maps
Use Interactive Geo Maps to display geographic areas in style. Each map is responsive and interactive. You can, for example, color in specific countries (and hover states), add hyperlinks, and display tooltips.
Upgrade to pro and get features such as cluster map markers and the ability to change the default zoom level.
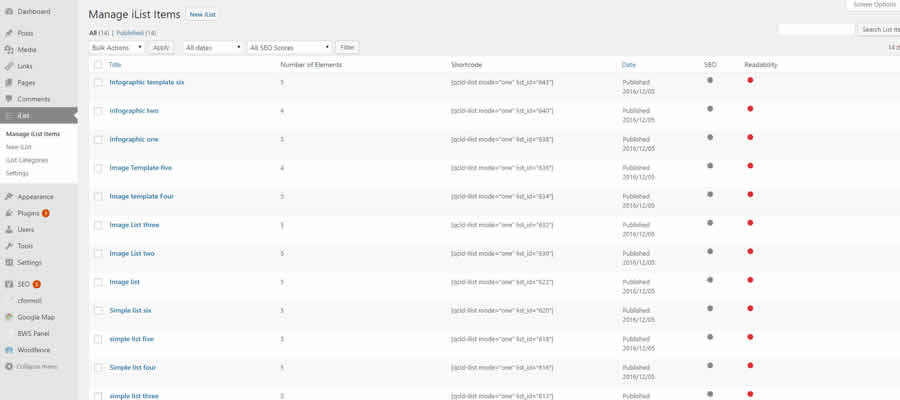
iList Infographic Maker
Need a quick infographic or listicle? Infographic Maker allows you to create these highly-visual assets directly within WordPress. Your creations can include all sorts of content – including various charts. It also works natively with the Gutenberg block editor.
The pro version includes the ability to add multipage listicles, along with plenty of customization options.
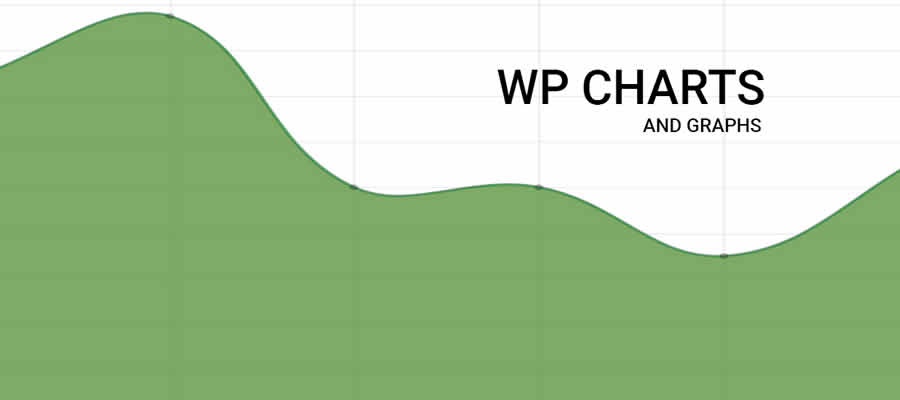
WP Charts & Graphs
WP Charts and Graphs features a visual building experience, complete with live previews. Chart types include bar, pie, polar, radar, among others. Adding the generated charts to your content is accomplished via a shortcode.
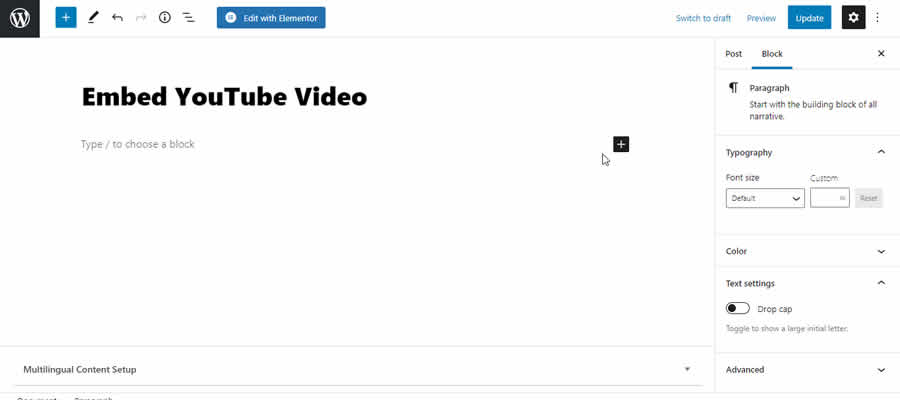
EmbedPress
Visual data can come from many places – and that’s where EmbedPress comes in handy. The plugin makes it easy to embed content from over 100 sources and works with the Classic Editor, Gutenberg, and Elementor.
Content from Google Docs, Wistia, and Spotify are just the beginning. It also takes local files such as PDFs and makes them viewable in your posts. Upgrade to pro to gain access to custom branding options and more.
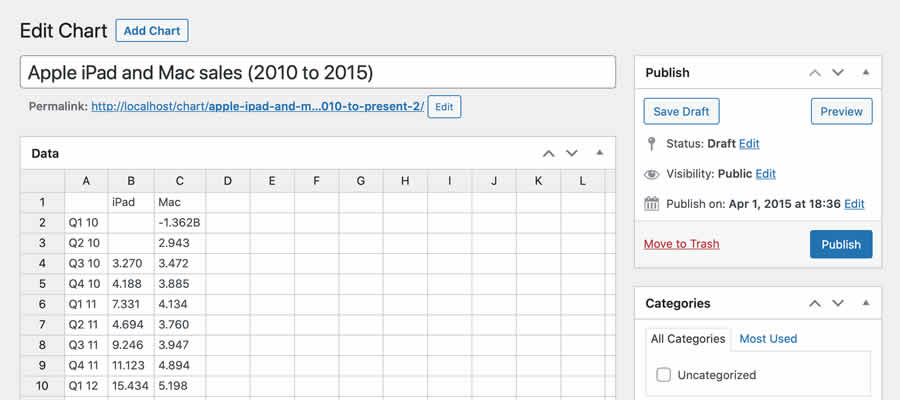
M Chart
Add your data via a spreadsheet-like UI, and M Chart will turn into a beautiful visualization. Choose from various chart types and which library powers them (Chart.js or Highcharts).
Chart images can be previewed within WordPress and embedded via a shortcode or permalink.
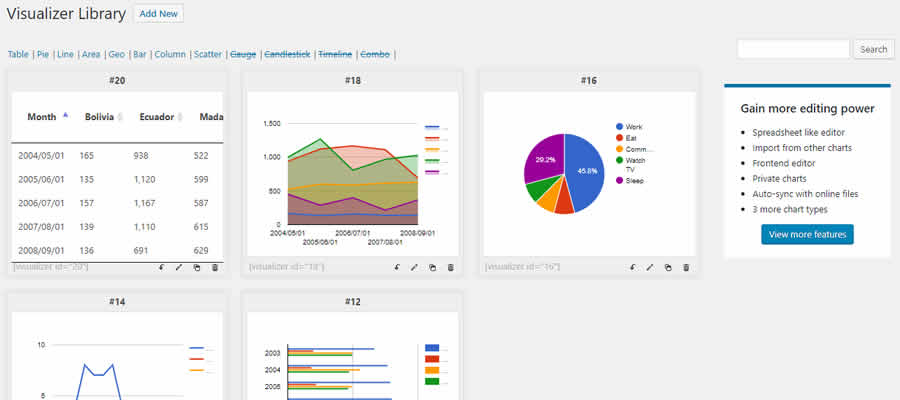
Visualizer – Tables & Charts Manager for WordPress
Visualizer enables you to create 12 different chart types, including line, bar, area, column, pie, and geo charts. Data can be easily imported via a CSV file.
Charts are displayed via HTML5/SVG to allow for a sharp display on any device.
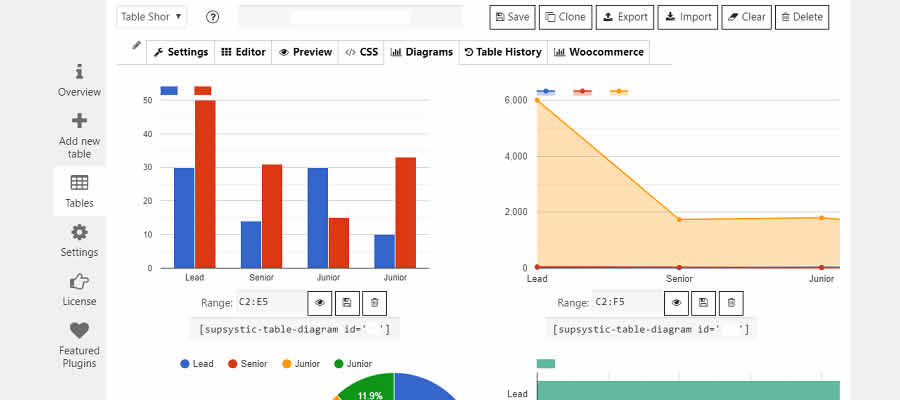
Data Tables Generator
Data Tables Generator lets you create interactive tables. They can be sorted and even have charts attached.
Tables are created within WordPress in an Excel-like interface. On the front end, users can export tables in various formats.
Responsive Mortgage Calculator
Sometimes, fancy charts and tables can hinder a user’s ability to decipher data. Responsive Mortgage Calculator takes a complicated thing (figuring out the terms of a mortgage loan) and makes it dead simple.
Users fill out a short, customizable form and get a simple text output of the results.

Calculated Fields Form
Those who need to dynamically generate calculations based on user input will love Calculated Fields Form. Various types of calculators can be created, including those based on date, pricing, weight, percentages, and good old-fashioned numbers.

It’s a Visual Medium
One of the keys to great design is ensuring that the user can access information and do so in a way that is easy for them to understand.
The interactivity that the web provides can be harnessed to do just that. Take advantage of the tools above and enable users to see your data in a whole new light.