How to Use Google Analytics Filters Like a Pro
If you’ve used Google Analytics for your website and have spent some time digging around your data, you know that there can be a lot to sift through. Thankfully, Google allows you to filter this data down to exactly what you’re looking for, but it can be confusing to use the filters if you’re unfamiliar with how they work.
In this post, we’ll explore how to use Google Analytics filters to better visualize your data, understand your website’s performance, and derive clear takeaways from your website’s metrics.
Use our free tool to calculate your score in under 60 seconds.
How is your website’s SEO?
Where are filters in Google Analytics?
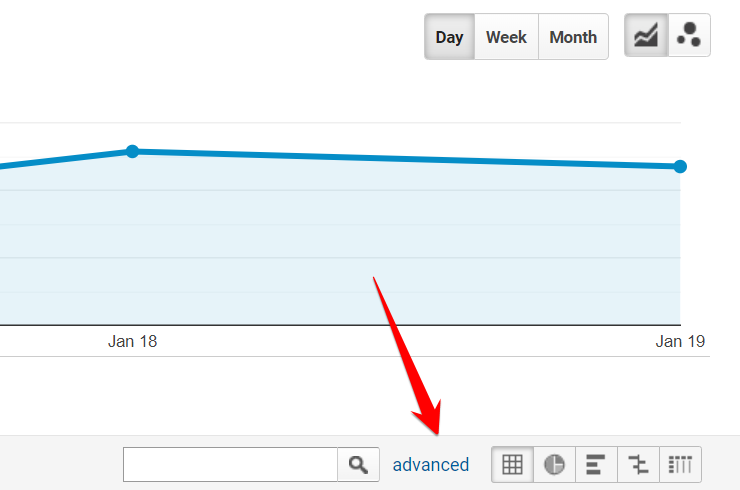
If you’ve never used Google Analytics filters before, they can be tricky to locate.
On most reports, you can create a filter by clicking the small link that says “advanced” just under the main data visualization graph.
How to use Google Analytics filters
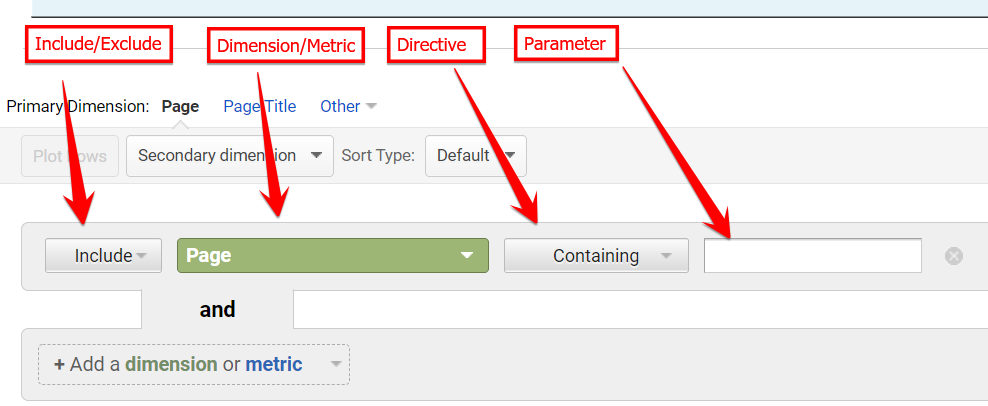
Once you’ve clicked the link and opened the filter, you’ll see a few fields you can change and type in to filter your data. These options are:
- Include/Exclude: Include the following parameters in the data or exclude them
- Dimension/Metric: The dimension or metric you are filtering
- Directive: How you will be filtering the data
- Parameter: The value you are filtering
With these settings and a little know-how, you can filter just about anything out of your data.
You may already be thinking of some ideas of how to manipulate these fields already, but let’s run through an example. Let’s say you only want to see how your blog pages are doing, and your blog pages have the word “blog” in their URL. You can use the following settings to only see blog page data:
- Include/Exclude: Include
- Dimension/Metric: Landing Page
- Directive: Contains
- Parameter: blog
Once you click apply, you’ll only see data for pages that match your filter, which are those pages that include “blog” in the page path. This will allow you to see exactly how the blog section of your site is performing without having to wade through other pages’ data.
Changing the dimension or metric
One of the most common things you’ll do with the filter is change the dimension or metric you’re filtering. Changing this setting is as easy as using the dropdown and selecting the dimension or metric you want.
However, you’ll want to be aware that you can only select dimensions and metrics to filter if they are visible on the table or data you’re filtering. For example, if you want to filter by Landing Page, but your primary dimension is currently Default Channel Grouping, you won’t see Landing Page as an option to select.
If you need to change your dimension, but the one you want is not in the dropdown as an option, you’ll either need to change your primary dimension on the report or add a secondary dimension. For metrics, you’ll need to add the metric to your report by clicking the “Edit” button in the top right corner and adding the metric you need to your chart.
You can also add several levels of dimension or metric filtering by clicking the “Add a dimension or metric” button in the filter itself. The same rule applies with having the dimension or metric visible on the report you’re trying to filter in order to select it as a filter option.
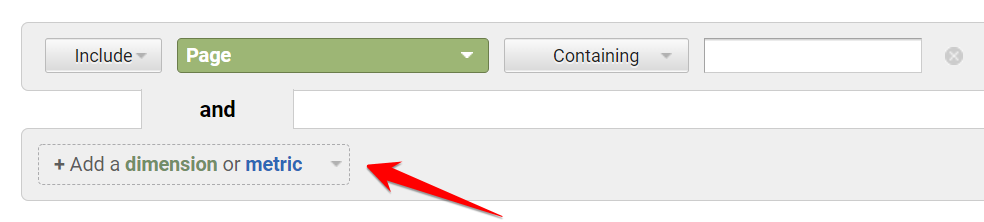
This will allow you to filter your data by multiple dimensions, metrics, or a mixture of both. It’s an easy way to get more specific with your filter and filter out unwanted data.
More complex Google Analytics filters
For most filters you add, you will most likely use either the “Containing” directive or the “Exactly Matching” directive. However, there are some filters you can do that require the use of some of the other directives.
One of those is the “Matching RegExp” directive. It is popular among those that know how to use it because of its versatility.
RegExp stands for regular expressions, which is a language you can use to match characters in a dataset. If you’re unfamiliar with regular expressions, RegexOne has a great tutorial to teach you the basics.
With regular expressions, you can get really detailed and complex with your filters — the possibilities are endless.
Let’s say you just want to see three pages that might not have any common denominator you could use for the “contains” directive (or at least you wouldn’t be able to do it in one line of filtering). You could pull just those three pages in the chart with these settings:
- Include/Exclude: Include
- Dimension/Metric: Landing Page
- Directive: Matching RegExp
- Parameter: \/page\/path-1\/|\/page\/path-2\/|\/page\/path-3
The pipes in between each page path indicate “OR,” meaning the filter can include page path 1, page path 2, or page path 3. The backslashes before the forward slashes are just there to indicate that we want to match the forward slashes, and we’re not trying to say something else about the filter since forward slashes have a different meaning in regular expressions.
You can also use the Matching RegExp directive to match multiple sections of your website on a single line of filtering. This can save you a little bit of time as otherwise, you would have to create multiple lines of filters to get what you want.
For example, the following settings would pull only your blog and products sections, given that each grouping of pages has a common denominator in their page path:
- Include/Exclude: Include
- Dimension/Metric: Landing Page
- Directive: Matching RegExp
- Parameter: .*blog.*|.*products.*
The dot and star characters on either side of our keyword are there to indicate that anything can appear before or after the keywords, but the important part is that we’re matching the word “blog” or “products” in the URL, as all pages in those sections have that.
Get what you need from your Google Analytics data
Now that you know how to use Google Analytics filters, you’re on your way to leveling up your data game. You can create custom dashboards, reports, and other visualizations for yourself or key decision-makers within your organization.
Instead of trying to wade through a lot of information that might not be pertinent to you, adding a few filters or using some regular expressions to pull what you need out of the data will save you time and a lot of headaches.
Google Analytics is a powerful tool that allows you to really dive deep into your site’s data if you know how to take advantage of it.
There are also many other settings and tools within Google Analytics outside of filtering that you can leverage to make your data as clean as possible. Check out these posts to learn more about Google Analytics capabilities:
- Intro to Google Analytics
- How to Use Google Analytics
- Google Analytics Certification
- Google Analytics Goals and Funnels
Need help with Google Analytics?
If you’ve been digging into your data on Google Analytics and you’re just not sure what to make of it, WebFX can help. We have a full team of Google Analytics and website experts waiting to partner with you and your business.
Check out our Google Analytics consulting services and connect with an expert. We’re looking forward to hearing from you and learning more about how we can help!